
How to Read Bitcoin Charts: A Complete Guide for Cryptotrading Success
With over $4.1 billion lost to DeFi hacks in 2024 alone, understanding how to read Bitcoin charts has become essential for traders venturing into the crypto space. Acquiring the ability to accurately interpret price movements and market trends can mean the difference between profitable investments and steep losses. This article breaks down the essentials of Bitcoin chart reading, tailored specifically for those ready to capitalize on the opportunities in the cryptocurrency market.
The Importance of Bitcoin Chart Analysis
Bitcoin is often heralded as the digital gold of our times, and just as gold traders rely on charts to make informed decisions, crypto traders use Bitcoin charts to navigate market fluctuations. Here’s why chart analysis is pivotal:
- Market Trends: Recognizing patterns helps traders predict future price movements.
- Buy/Sell Signals: Charts indicate optimal entry and exit points.
- Risk Management: Visual data helps in setting stop-loss and take-profit levels.
Understanding Bitcoin Chart Types
Not all charts provide the same information. Let’s explore the main types of Bitcoin charts and when to use each:
- Line Charts: These simple charts connect closing prices over time, offering a clear visual of price movements.
- Bar Charts: Each bar represents a specific time period, showing the opening, closing, high, and low prices, giving more data than a line chart.
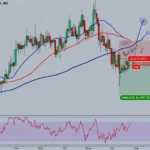
- Candlestick Charts: Like bar charts, but visually represent price movements over the selected time frame with ‘candles’ showing bullish (green) and bearish (red) movements.
Key Indicators in Bitcoin Chart Analysis
To effectively read Bitcoin charts, understanding key indicators is crucial:
- Moving Averages: These help smooth out price data by creating a constantly updated average price. They can highlight trends and reversals.
- Relative Strength Index (RSI): This momentum oscillator measures the speed and change of price movements, helping to identify overbought or oversold conditions.
- MACD (Moving Average Convergence Divergence): This indicator tracks the relationship between two moving averages to indicate momentum shifts.
Pivotal Patterns Every Bitcoin Trader Should Know
Recognizing chart patterns is a skill every aspiring trader must hone. Here are some classic patterns that can provide insights into market sentiment:
- Head and Shoulders: This pattern signifies a reversal trend and can predict price drops.
- Double Top/Bottom: Represents potential price reversal points, indicating bullish or bearish market sentiment.
- Flags and Pennants: These short-term continuation patterns suggest a potential breakout following a consolidation period.
Using Bitcoin Charts in Different Market Conditions
As market conditions fluctuate—bull, bear, or sideways—traders must adapt their strategies accordingly. Here’s how to approach each condition:
- Bull Market: Focus on buying opportunities and trend-following strategies as prices rise.
- Bear Market: Implement short-selling strategies and consider using stops to minimize losses.
- Sideways Market: Engage in range trading, buying at support levels and selling at resistance levels.
Integrating Bitcoin Chart Analysis with Fundamentals
While technical analysis is crucial, understanding the fundamentals influencing Bitcoin prices can enhance your trading strategy. Here are major factors to track:
- Market Sentiment: Monitor news articles, social media trends, and community discussions.
- Regulatory Developments: Changes in regulations can lead to significant market reactions.
- Adoption Rates: Increased adoption in countries like Vietnam reflects growing trust and potential price increases.
Practical Tools for Enhancing Your Chart Skills
Utilizing the right tools can expedite your learning process and improve your trading effectiveness. Here are a few recommended resources:
- TradingView: A powerful charting platform that offers a range of indicators and social features.
- CoinMarketCap: An essential tool for tracking real-time prices and market capitalization.
- Binance Academy: Provides educational resources specifically designed for traders.
Real Data: Bitcoin Trading in Vietnam
As of 2025, the growth rate of cryptocurrency adoption in Vietnam has soared by 30%. This surge signifies a promising market for Bitcoin trading. Understanding your local market dynamics gives traders an edge when interpreting charts.
Conclusion
Learning how to read Bitcoin charts is an essential skill for anyone involved in crypto trading. With a blend of technical analysis, awareness of broader economic factors, and local market trends, you can position yourself for success. Remember, a strong trader not only relies on charts but also continuously educates themselves on the evolving crypto landscape.
By harnessing these insights and strategies, you’re not just reading Bitcoin charts; you’re mastering them. Happy trading!
For more insights into cryptocurrency trading, visit hibt.com for seasoned guidance and tools.
Author: Dr. John Doe, a renowned blockchain researcher, has published over 20 influential papers in crypto trading analysis and has led audits for several high-profile blockchain projects.